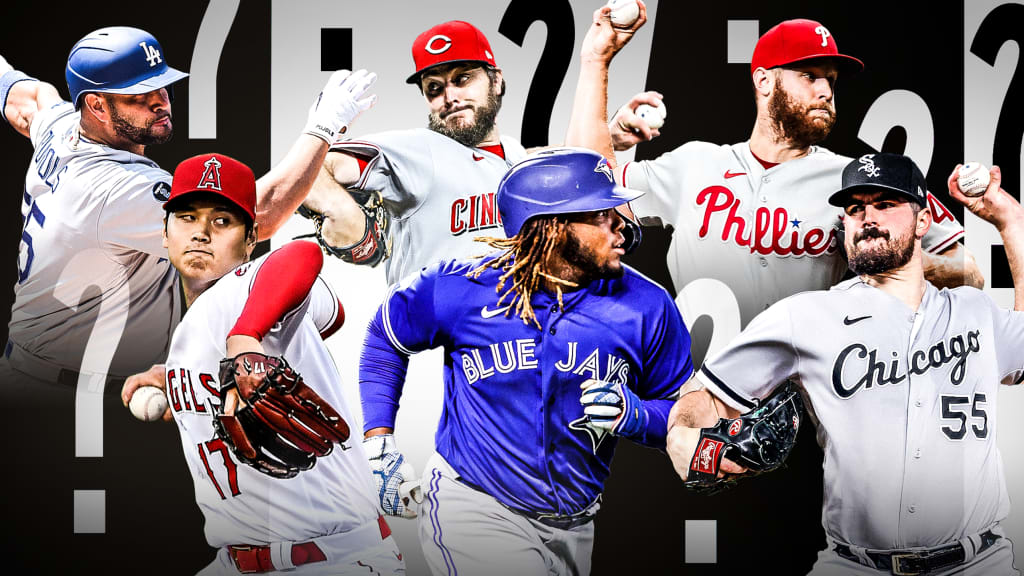
In the last article, I wrote about the pending free agents that are still available. Today, we are exploring the names that seem to be available on the trade market. Last night we almost closed out the CBA and it was extended into today, so I believe a deal gets done and the season starts as scheduled. There was just too much momentum created to think otherwise.
If it is true, that the season goes on without missed games, then the teams will have roughly 3.5 weeks to finalize their rosters. This creates a moving market daily and a chaotic pace to which teams are not accustomed. Each team’s GM will have to stay on top of their situation and act quickly to respond to what other teams do, solve their own issues, and field a competitive team for the 2022 season.
I have included a list of players who have come up in trade rumors or at least mentions in this offseason. They are both position players and pitchers. They ranked by projected WAR to provide a context of who might be able to catapult a team to success, who is there to fill a gap, or who is a money fit. Either way, if you combine this article with the free-agent article, you’ll have a relatively complete list of what to expect.
The possible trade candidate list:
The position player list is deeper in talent on this list than on the free-agent list. 1B Matt Olson and OF Byron Buxton leads the way. There are also more starting pitchers that can make a difference as well. That list is led by Sean Manaea and Frankie Montas. These players will cost prospects or big leaguers in return, so it will be interesting to see how the free-agent market, and the trade candidates will be utilized to improve teams.
Once the Lock Out ends, there will be a frenzy for MLB GMs to complete their team’s rosters. It might be a good idea to know what is available. I list the top FA available sorted by hitters, starting pitchers, and relief pitchers. They are ranked by projected WAR. A chart is below to suggest how good a player is based on his WAR number. WAR is wins over replacement. It is a simple stat that allows comparisons from player to player by year and by career. Replacement is equal to a call-up player. He is the substitute if that player was not on the field. Callup players are similar to what you would expect from a AAA player.
Here is the list of remaining FA position players or hitters.
There are 3 All-Star caliber players remaining which makes it difficult to do team projections as these are definitely players that could change the future of the team they land on. Those 3 are SS Carlos Correa, 1B Freddie Freeman, and SS Trevor Story. Kyle Schwarber slides into the Good Player category and there are 5 others that fit the SOlid Starter classification. All said, there are roughly 10 players that will make an impact on a team once they are signed.
Here is the starting pitcher list.
This list is not as deep as the position player list. There are only 2 pitchers that rate Solid Starter or Good Player. They are Carlos Rodon and Clayton Kershaw. After those two, the remaining players are role players. This just tells us that we several guys either getting ready to leave the game or we have lots of number 3 starters or worse available to be had.
Here is the list of relief pitchers. Keep in mind that the best relief pitchers will have a WAR of over 1.0 and the good ones will be above 0.5. For example, CHW Liam Hendricks is 1.5 WAR and Josh Hader is 1.4 WAR.
This list is much more difficult to maneuver because there is quantity not so much quality. There is no top-of-league relief pitcher available and no one is even close to being above 0.5. We see Andrew Chafin at 0.5. There are many at 0.1 but those are needed to fill out a bullpen which is why it is hard to maneuver. The idea here is that most of these guys are the same guy in terms of performance. Maybe there is a need for right or left-handedness or arm slot, which could make one a fit to a specific team more than another.
When MLB resumes play and we are not dealing with CBA, there will be a significant change to the National League. It has adopted the Designated Hitter that has been part of the American League since 1973. No more will pitcher have to bat! It really does align with modern-day baseball as the strategy of bunting is no longer deemed a positive play. I suppose if a pitcher bunts, it is another story, but now the NL will get to have another player who is paid to hit actually hit. I went through Roster Resource to see who is listed as the primary DH for all the NL teams. It is apparent that some teams are set up nicely even though there are few, and others will need to find a quality batter to fill this role. Here is the list of players on 02/22 that are the DHs. Keep in mind, the free agency period is not over and this could see dramatic changes (and likely will). Let’s do this by division so we will start in the East.
There is no doubt the team best suited for the DH is the Atlanta Braves. Marcel Ozuna could play OF but he is a great DH. They also have FA Jorge Soler, Joc Pederson, and Eddi Rosario. They are a team deep in hitters for their everyday lineup with the addition of the DH. NYM has found a spot for Robinson Cano (back from suspension) but can also plug in JD Davis or Dominic Smith. MIA, WSH, and PHI do not have a proven hitter for the role.
In the Central division, it seems these teams are a bit more suited with proven hitters or at least potential big bats. STL Paul DeJong is a proven big-league bat and provides SS Edmundo Sosa an everyday spot. CHC has newly acquired Clint Frazier. Hopefully, he has resolved the vertigo issues troubling him in the past. He is certainly full of potential. CIN can use a proven Mike Moustakas in the role. He used to be the third baseman and moved to second base for CIN, and now can just hit. Jonathan India is now the 2B, and Eugenio Suarez plays 3B. Great way to deepen their lineup. PIT has Michael Chavis listed. The former BOS slugger is full of power. If he can develop to become a better contact guy, he could be a big addition. MIL seems to be looking to fill the role.
In the West, I found it interesting the LAD would have Gavin Lux in the role. LAD will not employ a full-time player in this role. As they do with many players, they will alternate in their role and utilize matchups to fit the need. COL using Charlie Blackmon is a good fit. He is declining on defense but still has a big bat, plus is a proven hitter. SFG Darin Ruf is a good fit too. He is the backup 1B and does play OF, but this will give his bat more of an everyday feel. SDP Jurickson Profar will have an opportunity to get his bat in the lineup. He is a middle infielder with no spot as Fernando Tatis and Jake Cronenworth are now entrenched in their roles. ARI does not have a proven hitter for the role.
All said and done, ATL is the best-positioned team, and with Free Agency yet to finish, they have the potential of superstar throughout their batting order. NYM, CIN, STL are all teams with proven guys for the role. It appears though, that we should see plenty of swings in this market once we get back going again as most teams need to get better in this spot.
Every team plays 162 games a season in MLB. There are 32 teams, so there are 2592 games played not including playoffs and World Series games. There are many opportunities to get a wager on an MLB game! The standard is the Money Line wager or the total of the game, but there are yet many other types of wagers and strategies that are necessary. MLB often presents scenarios where it is not feasible to make a wager on a side or pick the winner in a game. This is due to the variance of quality in teams and starting pitchers. Often, there will be a posted Moneyline of -200 or more. This simply means you must wager $200 to win $100. Herein lies the problems of winning MLB wagers for a season. Let’s look a bit deeper.
Opening the 2021 season, the LA Dodgers played the COL Rockies in Colorado. Game 1 was a pitching matchup of Clayton Kershaw and German Marquez. LAD was a -216 FAV. The final score was 5-8L, so they start at -$216. Game 2 had a pitching matchup of Trevor Bauer and Antonio Senzatela, LAD was a -245 FAV. The final score was 11-6w, so they gained $100. This calculation is based on wagering 245 to win $100, and now LAD is -$116. The 3rd game saw a pitching matchup of Walker Buehler and Jon Gray where LAD was -217. The final score was 6-5w so another +$100 for LAD. LAD is now 2-1 on the season yet still -$16. The 4th game and final game of the series was a pitching matchup of Julio Urias and Austin Gomber where LAD was a -205 favorite. The final score was 4-2w and another $100 for LAD, now they are +$94 on the season. LAD is now 3-1 yet only +$84 on the season. The moral of this story is if we wager BIG favorites, a loss is hard to overcome. In this scenario, it took 3 consecutive wins to overcome the 1st defeat and we are still not 1 unit positive. A sound wagering strategy is necessary and it must be combined with utilizing the various types of wagers available to us. It is often said that baseball is a cerebral sport. I would suggest it is cerebral in how it is played, and it is cerebral in how to wager on it. We need to do our homework, or we will not have a successful campaign.
Let’s start by putting in some specific guard rails. First, we should not be wagering any FAV of -150 or more on a regular basis. The simple math is -150 suggests an implied winning percentage of 60%. We must now win 61% of these wagers to make a 1% profit. A standard NFL wager is -110 (52.38%) where the common saying “we just need to win 53% of our wagers to make money” comes from. Now we can’t say that anymore! We need 61% winners. As illustrated in the LAD opening series above, playing -150 favorites “eats” your winnings when they lose, and they are expected to lose 40% of the time! We want to wager on smaller favorites and underdogs.
Underdogs provide plus-money scenarios, and we don’t even need a winning record to be profitable. If we are on the other side of a -150, we would be on the underdog side getting +135. Let’s say that in a 3-game series all -150 for every game the favorite goes 1-2. We would be -$200 while betting on the favorites. If we’re wagering on the underdog, we would be +$170 (+135, +135, -100). The favorite is down 2 units and the dog is up almost 2 units. Big swing of variance here. Thus, we do not want to bet big favorites often! I would also argue wagering big dogs is not a winning formula by itself either. An underdog at +180 requires a winning percentage of 35.71% to break even. We need to expect to lose this eager 65% of the time! If your strategy is to bet on these games, pick your spots wisely. A good mix of small favorites and underdogs is the optimal wagering strategy.
Now let’s look at how we can get into some of these situations where we have been shut out because the favorite is too high. One way to get in on the game is we can bet the total runs scored in the game. This line will have no correlation to the heavy favorite so it will be much nearer the -110 standard wager odds. If you still want to look at the side, we need to shift to the run line as opposed to the money line. The run line now is a point spread line. The favorite will need to cover -1.5 runs and the underdog stay within +1.5 runs. Pay attention to who the home team is. It is commonly referred to as an error to be the home team on the run line. MLB is 9 innings to complete a game. Let’s say the home team is ahead 5-4 going into the 9th inning. Now we’ll say they got all the outs, and the inning is over for the visitors. Because they are not required to hit in the 9th inning as the game cannot be won by the visitors, the game is over and the home wins 5-4 only batting 8 times. The home team is at a disadvantage and as an investor, you need to make sure you don’t get burned by it. The run line can be popular because it dramatically reduces the Moneyline. Let’s go back to the LAD opening series. Game 1 was -216 but -143 on the Moneyline. Game 2 was -245 and -163 on the run line. Game 3 was -217 and -140 on the run line. Lastly, game 4 was -205 and -140 on the run line. Let’s look at the results if we wagered on the run line. The game was a loss, so we start at -143. Game 2 was a win and covered the -1.5 (11-6) so we gain $100 and are now -43. Game 3 was a win (6-5) but we did not cover the -1.5 so it is an against the spread loss! We lose -140 and are now -186. Game 4 was a win (4-2) and cover, so we gain 100 and are now -$86 for the series even though LAD is 3-1. Again, MLB requires a proper strategy to make money. Wagering on the money line was more profitable for this series +$84 than was wagering on the run line -$86 even though we would have paid much too high of odds to do so. Just remember that run lines are spreads and they do come into play. The odds are much cheaper, but the value is not always equal.
Another way to get into these games is the first five innings wagers. These are gaining so much popularity because much of the handicap is based on the starting pitchers and the bullpens are not easy to handicap. We can wager the first five innings on the money line or run line (totals as well) just like a regular game. For this wager type, the game ends after the home team has batted in the 5th inning. The game money line and the first five innings money will be very similar. The run line is vastly different though because we are not tasked with -1.5 runs to cover, we only need -0.5 runs. The run line is good for converting those big favorites and we are wagering on the starting pitcher to be good for 5 innings. Another good understanding is that the home does not get shorted their at-bats. They will bat in the 5th inning, so this is a particularly good spot to look at home favorites that are too large on the money line.
A strategy to employ here is to understand the length expected to pitch and the quality of the starting pitchers. We should not expect to have the bullpen come to save us. We are expecting the starter to pitch the full 5 innings and pitch well if we are on him or poorly if we are against him. Teams with good offenses, and that get length from their starting pitchers are teams that do well in first 5 wagering. Sometimes, we have a good starter but a poor bullpen. This is another spot where a first 5 inning wager can suffice. We can avoid the bad bullpen altogether. Good offensive teams only must be ahead by the end of the 5th inning. If their matchup is good vs the opponent starter, they are a team worth looking into. The only thing to remember when wagering the first 5 innings on the run line, a tie game is a loser for the favorite and a winner for the underdog. The next few charts show results for the teams on the first five innings wagers for 2021. The first one is the team money line. The 2nd one is team totals and the 3rd one is the team on the run line.
This is kind of like “Old School” vs “analytics”. It is the idea that moving runners is how to score and how winning should be done. Of course, that is not how baseball is played at the big league level, so it is worth the adventure to see how and what is going on. Credit to the stats guys out there that there actually is a way to measure moving runners. It is called Productive Outs. I will be looking into that plus some other data points to create a correlated story of how winning is done today.
The first thing I am going to look at is base runners and how often they score. The following image shows all the teams with how many baserunners they had, and how many runs scored of those baserunners. The league average was 14.30%.
This image is VERY telling in many ways. First off, look at the teams at the top of this list. Rays, Jays, Astros, and Red Sox were all playoff teams! Only Giants, Cardinals, and Brewers were not above the MLB average from the teams in the playoffs last year, but they were very close to it! It tells something we already know but maybe didn’t put enough emphasis on. First and foremost, winning is done by getting baserunners then driving in those runners, and hitting Home Runs. Let’s look at TB Rays. They had 3736 base runners and scored 16.50% of them (618). Look near the bottom. PIT Pirates had 3712 base runners (only 24 less than TB) yet scored 12.40% of them (471 runs). The variance was 147 runs with only 24 fewer base runners! That is pretty close to 1 run per game less (actual is 0.91 runs per game)! Yet, look at the NY Yankees! They only scored 1 more base runner than the Pirates! Let’s look back a bit and dissect this on another level. TB scored 857 runs in 2021 but only 618 of them were from base runners (72.1% of their runs came from base runners). They hit 222 Home Runs which is where the majority of the rest came in, so now they have 840 runs when the HRs. They scored 17 runs via weird other things. PIT scored 609 runs (which 471 were from base runners) or 77.3% from base runners. They hit 124 Home Runs for a total of 595 runs from base runners plus HRs. They had 14 weird runs scored. The NY Yankees scored 711 runs (472 from base runners) which 222 came from HRs. They had only 66.3% of their runs accounted for via base runners. We are showing this so we can get to the next level. However, wRC+ does correlate to a degree the ability of a team to drive in / create runs via base runners. It also includes HR so it is very good at identifying these issues and strengths. TB 109 wRC+ or 9% better than the average team and finished 3rd. PIT 83 wRC+ or 17% worse than the average team and ranked 29th. NYY 101 wRC+ or 1% better than the average team ranked 9th. This shows the importance of being on base and how beneficial HR is.
We are going to look now at Productive Outs. A productive out is advancing a runner with one out, driving in a base runner with the 2nd out, and a successful sacrifice by the pitcher with one out. Ideally, this is the “old school” philosophy of get ’em on, get ’em over, get ’em in. However, does it work?
The MLB average of successfully moving a runner is 26.40% or roughly 1 out 4 times. Look at the teams on the top of this list! There are 5 playoff teams above the league average and six below it! In fact, the team with the best record in MLB (SF Giants) was the worst team in MLB at moving runners! It means that moving runners is not a critical component of winning baseball. There were only 8 teams with a worse record than the KC Royals last year (74-88, 14 games under .500) yet they were the best team in MLB at moving runners over and it wasn’t even really close! Maybe for them moving runners helped to score runs as they finished 11th in scoring percentage of scoring their base runners, but I will go further to say, if they were to focus on the 129 base runners below the league average that they finished (KC 3526, MLB AVG 3655), they would have scored more runs and won more games than the moving the runners helped them. Right now the correlations are base runners, and Home Runs. Now let’s get into some more!
Here is one that is a bit of a stretch but never really looked at. It is the Ground into Double Play. Once a team has base runners, it is a KILLER to have them wiped off the base paths by a double play and the teams good at staying away from those were some of the best teams in the game!
This image shows the teams with the fewest GIDP at the bottom and the most at the top. It is not a mistake to see the Rays, Braves, Dodgers, and Red Sox excel in staying away from GIDPs! These are very good teams and this is one of those reasons they are great teams. We illustrated above that the NYY had issues getting their base runners to become runs. Looking at this, it is no wonder! They led all of baseball in GIDPs! It is the easiest way for your team to NOT score runners on base and they were the best! This also creates another valuable look into wRC+ because NYY ranked 9th with 101 even though they had 154 runners wiped off by GDIP! wRC+ values the HR and the remaining productivity scoring appropriately. What if this team just hit into the average number of GDIP? They would have more runners, thus more runs. Simple ways to get more runs or wins. I believe this is a mental focus when batting. Some teams/players have a do damage theme, and others have a don’t hit into double plays theme. It is interesting to note that the Rays (tied 222), Braves, and Dodgers hit as many or more HRs as did the NYY! It is possible to do damage and play smart baseball. Now the correlation is base runners, Home Runs, and do hit into double plays!
Another correlation is the groundball to flyball ratio. It makes some sense. Hitting ground balls create double plays, is generally not barreled up and has 5 defenders to cover the area. Hitting flyballs reduces the double play to nearly zero, is usually hit with a greater exit velocity (barreled up), and has the potential to do more runs coring damage. It seems likely that if a team is good at hitting more flyballs than groundballs, they should score more runs thus win more games. Let’s see.
Look at the teams atop this list! Giants (best record in the game), Dodgers (2nd best record), Braves (World Series Champs), Blue Jays (AL-best Offense), Astros, Red Sox, and Cardinals were all teams that made the playoffs and they are #1 thru #7! Only the White Sox, Brewers, and Yankees were below-average teams that made the playoffs. This is definitely a correlation to winning baseball! Combine this with base runners, Home Runs, and not grounding into double plays and you have a team that is going to win games. It is not about moving runners over anymore!
In summary, it is imperative to get as many runners on base as possible, hit Home Runs as opposed to moving runners over, stay out of double plays, and hit flyballs. The best teams in MLB do the majority of this and they win games. A productive offense should resemble these characteristics as much as possible. Certainly pitching is a component all to itself but that is for another time. “Old school” theory can still apply in certain situations and off the normal game theory model spots (such as a pitcher’s duel), but it no longer is the smart way to play the game to win.
Game Score is a data point I have used for several years. It is a starting pitcher’s performance report. Ideally, it tells us how effective the pitcher was in every start he has made. While it will not tell us exactly how he will pitch today, it does have predictive qualities when we apply sequencing and patterns to it. It also can be used in a couple of very specific situations such as the start of a season and when the pitcher is off a very poor result. I will get into all of this but let’s first explain Game Score (GSc), why it is effective, and how it is calculated.
Bill James was the creator of GSc. As we have come to know, a pitcher’s individual win and loss records are quite meaningless in the context of quality of performance. Wins and losses many times are not in the control of the pitcher as the offense, the defense, and the bullpens tend to factor into these wins and losses more often creating a false narrative of quality based on wins credited to the pitcher. Game Score is an effective tool and has been revamped from the original creation to even be more precise. Game Score v2 is the better choice to utilize. As you can see in the graphic above, GSc is a calculation based on performance and length of time on the mound. The graphic is the traditional or first version of GSc.
Game Score v2 is very similar in layout with a couple of variances. I will go over the calculations which then will also further explain the original calculation shown in the graphic. GSc only applies to a starting pitcher. GSc v2 begins with the pitcher at 40 points (GSc was 50). Here is the rest:
40 +2 outs +1 K -2 walks -2 hits -3 runs -6 HR
(Note: The K is double-counted, 2 points for the out, and 1 extra. The HR is double-counted, 2 for the hit, and the 6 extra.)
The differences are in the starting point of 40, walks are more costly from (-1) to (-2), innings over 4 are removed, and the Home Run is added separately. This provides a more accurate assessment of the quality of performance the pitcher gave. This version is quite linear in that the result matches a percentage of the time the performance would win a game. If a score was 55, then it can be assumed that 55% of the time, that performance would win the game. Let’s use it for a random game. This box score is the pitching box score from the Marlins @ Braves 09/10/2021 where the Braves won 6-2.
MIA Trevor Rogers threw 4.1 Innings allowing only 3 hits but 4 runs. He did strike out 6, but what kind of performance did he turn in via GSc v.2? He produced a GSc52. The average MLB GSc is 50, so he just slightly better than average. On the season, Rogers averaged a GSc59 which is elite. ATL Ian Anderson threw 5 innings allowing 5 hits and 2 runs. He struck out 9 but allowed an HR. His GSc was 53. His season average is GSc53.
The purpose was to show how the score is calculated and how it reflects the quality a pitcher threw. In this case, Anderson threw slightly better than Rogers but could have had a much better outcome had not allowed the HR.
Now we can discuss how to use Game Score in predictive ways. First, let’s talk about the start of the season. As we are speaking in numbers, we need to understand averages and median averages. Players are not robots and will have good and bad days, thus their performances will fuxuate. The better (or higher GSc) a pitcher produces, the less fluctuation should be expected. Each pitcher must establish the bar of their performance or their “median” average at the beginning of the season. This is where we can gauge performance to be expected via sequencing. It takes roughly 4 starts to establish this. The median is the middle score of a distribution. Let’s use Ian Anderson from the above game as our model player.
We are looking at his game logs for 2021. It is chronological in order from bottom to top. His top line is his season average. GSv2 is the column on the far right. As you can see, there is a value for every game he started and his season average is 53. At the beginning of the season, his GSc results for these first 4 games were 56, 42, 47, and 68. His mean average or his “bar” was established at 53.25 for those games. Now we have a regression or progression process to follow, but before that, we need to discuss these four games! Virtually every pitcher will go thru high, low, and average performance in their first 4 starts thus establishing their quality “bar”. We can check them off kinda like clockwork using patterns to forecast what type of outing we can expect. Remember we have boxes to check off in these first 4 starts (HIGH, AVG, and LOW). Anderson started with 56 which at the time we know is above the MLB average 50, so we can assume it is going to be within the AVG box. It is not over 60 which is a very good start and we are looking for one of those. Going into his next start, we can assume he will either throw a HIGH or LOW performance game because his AVG box was checked off. Seeing how it was nearer to the HIGH side, it can be assumed a lower result should be expected on this start (regression to the mean). Remember, we are establishing a median average where there will be variances so we will expect them and make plans to predict the performance based on that. His 2nd start was a GSc42 which will check off the LOW box. His current GSc for the season is 49 and barely below the average pitcher. Now we can assume he will throw AVG or better in his next two starts because he has already checked off the LOW and yet to check off the HIGH. His 3rd start was a GSc47, which again means he did not check off that HIGH box. While assuming he would’ve thrown better prior to this game or at least a high avg game, this one sets us up for what we are looking for. He has yet to hit that HIGH box and his 4th start is on the way! We can only assume this will be the one. We can assume this again because he has yet to have a HIGH score and needs to progress the mean average as he is below the bar right now. His 4th start was a 68! There we go. It means he threw an excellent game and we anticipated it. This comes in very handy when trying to make wagers! If you “know” he will throw either a good or bad game, we have an edge that we can capitalize on!
Another scenario where we can certainly use GSc to gain an edge is where a pitcher is off a terrible start. The average start in GSc50. When a pitcher has thrown something under 40, it is a terrible day. What tends to happen after that start? The law of averages kicks in(progression back to the mean). The below 40 starts have lowered the season average below the median average, so we should expect an adjustment up to correct that. It can happen in the very next start or it may take two great starts in a row, but we can expect above-the-bar performances off of below-the-bar performances. Let’s look at Anderson to see if this comes through for us. On 5-29-21 he faced the NYM and threw a Gsc30. We will expect his next start to be above average or better. He threw a 52 which is slightly higher than average and not the offset to the low score we need so in this case he will likely use two starts to get there. His next is the jackpot! He threw a GSc76! Other starts below 40 for the season were 07-11 GSc18, where his next start was a GSc62, and 09-04 GSc18, where his next start was a GSc53, and lastly on 09-17 GSc37, where his next start was a GSc81. We can see the pattern here. Expect good to great performance off of poor ones. It is also true to expect poor or AVG starts of great ones. It is just the law of averages (regression/progression) but if used properly, we can predict to a degree of what type of performance we should expect.
Games Score can be a valuable tool if utilized in the proper ways. Standing alone, it is a data point that accurately grades performance. When applied to patterns and sequencing, we can see predictive tendencies that will generate a profit for us.
There are projections from almost every major outlet available on players. These are handy when trying to make a fantasy roster, but we are going to try to determine how many wins a team will get. We want to be able to make some quality future wagers on team total wins and playoff odds so individual player projections will come in handy for some insight especially considering the influence we should apply. The major focuses should be utilized elsewhere. Let’s explore.
We could start off by utilizing the team’s won/lost record. If we did this, we would not be accurate in valuing its strength. Let me explain. A better way to determine the strength of a team is by utilizing the Pythagorean records. These are based on runs scored and runs allowed. Baseball teams can be unlucky or lucky, or productive or less productive, hence they will either win games they should have lost or vice versa. Pythagorean records indicate what a team should have done based on its productivity removing the luck factor, thereby creating a more accurate view of its ability to win games. Last year the SF Giants won 107 games. The LA Dodgers won 106 games. It can be said the Giants were lucky to have won 107 games though. Based on their runs scored and allowed, they should have only won 103 games, still outstanding. The Dodgers were unlucky as their true win total should have been 109 wins! The Dodgers are actually 6 games better than the Giants is a more accurate view than if we went off their actual records. This is significant when forecasting this year’s team win totals. We need a starting point and the Pythagorean example is a good one.
Another view we should check into is the Base Runs model. Base Runs is a model similar to Pythagorean Theory (runs scored vs runs allowed) in that it looks at expected runs scored and allowed. It is based on a normal distribution of runs scored or allowed given the type of hits and sequencing of those hits instead of raw data points. The Base Runs model is the most accurate model available to us. Using the same teams from above, the SF Giants should have won 103 wins and the LA Dodgers 107 wins using the Base Runs model. In this case, the Dodgers are 4 games better than the Giants.
Here is a breakdown of the divisions with both Pythagorean and Base Runs models.
Once we get our starting point, we need to look at the make-up of the player performances. This is where the projections can come in handy. I can not tell you which projections to use (I use Steamer) yet the premise should be the same for all projections. We are not exactly trying to know who will hit more HRs than last year. We are trying to know if they are going to be more or less productive than the last year. There is a significant way we need to value these players. We will look at the Giants. Here are their Steamer projections for 2022.
Here are their actual performances from 2021
We are looking for significant variances. For this team, there are many! The 2022 projections have Brandon Crawford with 1.2 OFF WAR and 2.6 WAR (his value is on defense). His 2021 actual performance was 27.8 OFF WAR and 5.5 WAR! He was All-Star worthy in 2021 and is projected to be just an average player in 2022. That is a HUGE drop-off from their leader in producing offense. A further look into this indicates 2021 was a career season for him (his career data is the next graphic). He is not a spring chicken so he should not be expected to back up a career year with another one. He should be expected to have BIG fall off, and he does.
A team such as this one is in for a big fall. It is because their best contributors had career years and are not going to be expected to back them up with equal or better ones this year. The 2021 Giants had four players with double-digit OFF WAR success, but they only have projected in 2022 (Brandon Belt) and he is only projected to be half as productive as he was in 2021! The more regression we see in players is mainly due to their age and if they had career seasons. Younger players tend to build off of what they did and are expected to improve. The make-up of each team is a considerable factor when looking at forecasting. Certainly, we do not just look at the batters either. We need to look at the starting pitching and bullpen in the same way too.
Another factor to consider is the losses and gains a team will have had during the off-season. Free agents come and go in this sport. We need to know if the team needs to overcome losses, or if they are getting stronger because they have added better talent. in some cases like the Giants, they could have had a producer retire. Buster Posey was the team’s 3rd best OFF WAR player in 2021. He has retired and will not play in 2022. This team now has diminished all of its former OFF WAR contributors! Posey retired, Crawford should revert back to a normal season, Belt is only half as good as last year, and Ruff will see a diminished usage role, plus he too is off a career year!
We need to consider the callups as well. Identify the best prospects in the game as they can be big producers right away. They are generally forecasted conservatively, but they can add big value to some teams. The Giants will be using Joey Bart this season for example. He will replace Posey behind the plate. He is not expected to be the hitter Posey was, be he is good on DEF. A team like Tampa Bay has the number one prospect in all of baseball in Wander Franco. He will get his first shot at a full season and should be a big contributor to the team wins.
I like to work from the Base Runs or Pythagorean model to the projected win totals. I like to see what variances are, then see if they are explainable via player regressions/progression, additions/subtractions, or prospects getting their chance to play. SF is projected at 82 wins for 2022. This is a 21 game drop-off from 2021! We did not go over their pitching but if it is like their hitting situation, the variance is explainable. If all things were equal, then we would have to see if the Giants made improvements that would have them at minimumm4 games better so they could catch the Dodgers. In this case, they are much worse. We do this exercise for every team, then we can get some win projections to work with. We must be able to explain variances and to keep the integrity of the true win gap at the start. Teams either improve enough to move up compared to their rivals or they fall back. It is possible to have teams improve or fall and still be in the same slot, meaning their rivals did the same. It is a fun exercise and an important one. The 2022 forecasting cannot be done because Free Agency has yet to be completed! It will be a mad dash at the end of the lockout but if you are ready, you can get the jump on the early odds from the sportsbooks!
The majority of National media is just a group of writers that I personally have a hard time with. The exploitation of words and opinions is spinning logic and rational thought into sides and irrational thought. Anyway, it has been reported that MLB and the players union met via zoom on Thursday. The report’s first comments are that a deal was not reached! Well, no s%@t! It wasn’t expected to be a day where we had a deal made. In fact, this is the very 1st time these two sides met to discuss core economic issues since the lock-out began back on Dec 2nd. My two cents are that it was optimistic to have the sides evaluate a proposal that was made! Yes, MLB put forth a proposal. Now The union can say no, counter the proposal and we have movement. That is how this works.
The core union issues are 3 fold. They want young players to make more money quicker. The CBA of old favors the veteran players. The prospects are on rookie deals and have to wait for arbitration to grow their contracts. Hence, the union wants a quicker timetable for arbitration. The union wants a quicker timetable for free agency. Currently, it takes 6 years for players to obtain free agency rights. The union also wants a new revenue-sharing plan.
MLB has already provided concessions to the union. They have allowed a universal DH, an NBA style draft lottery format, an increase to the minimum player salary, an increase to the competitive balance tax, and the removal of the qualifying offer; which removes draft picks being part of the compensation for free agents. MLB has also offered a 14 team postseason format.
It is now just a matter of the sides continuing to talk. We need proposals and counter-proposals. If that stops, that is where we need to raise our fists. Let the process work out. Baseball will happen, we just don’t know when or how yet.